

Structuring Investment Properties: Navigating LLC Taxation & Connecticut’s PET Changes

Real estate investors often use Limited Liability Companies (LLCs) to hold investment properties for liability protection, tax efficiency, and estate planning. However, taxation rules—both federal and state—can significantly impact how an LLC operates financially.
Exploring Tax Elections: The Role of Form 8832
LLCs are typically taxed as pass-through entities, meaning profits and losses flow to individual members’ tax returns. However, an LLC can file Form 8832 to elect corporate taxation, allowing the business to:

- Retain earnings within the LLC rather than distributing profits to members immediately.
- Take advantage of corporate tax rates, which may be beneficial for high-income investors.
- Structure ownership more flexibly, making it easier to reinvest in properties.
For real estate investors, this election is not always necessary, but it may offer strategic benefits depending on their financial goals.
Connecticut Taxation vs. Federal Treatment
While Form 8832 changes how an LLC is taxed federally, Connecticut has its own taxation rules that may not align with IRS classifications. One major consideration is Connecticut’s Pass-Through Entity Tax (PET).
Previously, Connecticut required pass-through LLCs to pay a 6.99% tax at the entity level, regardless of how they were taxed federally. However, as of 2024, LLCs can opt out of PET, allowing individual members to handle taxes instead.
How PET Opt-Out Could Benefit Investors
Some real estate investors may choose to opt out of PET due to:
- Lower individual tax rates—LLC owners in lower tax brackets might pay less by handling taxes personally.
- Multi-state investments—PET credits may not be recognized outside Connecticut, making it harder to offset taxes in other jurisdictions.
- Cash flow flexibility—Keeping funds within the LLC rather than paying tax at the entity level could benefit reinvestment strategies.
On the other hand, opting in to PET could be useful for investors looking to simplify tax filings and claim state tax credits.
Finding the Right Approach for Your Investment Strategy
LLC structuring isn’t a one-size-fits-all decision—each investor’s situation is unique. While these tax elections and state regulations offer potential advantages, consulting a tax professional ensures compliance and financial optimization.
📩 Let’s connect and explore how we can build your investment strategy together!
As a realtor specializing in investment properties, I help investors navigate real estate decisions that align with their business structure and long-term goals. Whether you’re looking for new investment opportunities, guidance on real estate transactions, or strategies for managing your portfolio, I’m here to help.

 Facebook
 X
X
 Pinterest
 Copy Link

CT Real Estate: Buyer’s Market On The Horizon, Or Is Connecticut Different?
CT Real Estate Investors: Will Our Market Follow the National “Buyer’s Market” Trend? Facebook X Linkedin You’ve probably seen the national headlines predicting a widespread shift to a buyer’s market. But here in Connecticut, the story is often more nuanced. While some regions across the country are seeing significant inventory increases and price corrections, our […]

AI Driven Seismic Shift in Commercial and Residential Real Estate
The AI Paradox: Navigating a Seismic Shift in Commercial and Residential Real Estate Facebook X Linkedin The corporate world’s relentless pursuit of “lean” operations, largely powered by aggressive AI adoption, is not merely an internal efficiency drive. For property owners and real estate investors, it represents a profound, interconnected transformation that extends far beyond a […]

Mortgage Interest Deduction: What Homebuyers Need to Know Now
Navigating the Mortgage Interest Deduction: What Homebuyers Need to Know in 2025 Facebook X Linkedin Buying a home is a major life milestone, and for many, the potential tax benefits associated with homeownership, like the mortgage interest deduction, are a welcome perk. However, if you’re buying a home today, it’s essential to understand that the ability […]

Don’t Just Vacation in CT This Summer, Scout Your Dream Shoreline Home!
Summer Scouting for Your Connecticut Shoreline Dream Home: A Strategic Approach Facebook X Linkedin Summer in Connecticut brings out the undeniable allure of the shoreline – the sun-kissed beaches, the vibrant coastal towns, and the promise of a relaxed lifestyle. While the warmer months offer an ideal time to enjoy all that the shoreline has […]

Is Connecticut’s Housing Market Right for You? Key Stats & What They Mean
Connecticut’s Pulse: What Demographic and Economic Trends Mean for Real Estate in 2025 Facebook X Linkedin Connecticut’s real estate landscape is a dynamic interplay of population shifts, economic vitality, and social indicators. As of the most recent data, the state presents a compelling picture for anyone involved in buying, selling, or investing in property. Connecticut […]

Opendoor’s AI Flop: Your Agent is Still Your Best Bet
Don’t Toss Your Agent Just Yet: Opendoor’s Settlement Underscores the Enduring Value of Human Expertise in Real Estate Facebook X Linkedin WEST HARTFORD, CT – June 17, 2025 – For years, companies like Opendoor have positioned themselves as the future of real estate, wielding the power of AI to disrupt traditional methods. Their promise: accurately […]

Is Your House Feeling the Pinch? CPI, PPI & The Profit Squeeze on Homes
The Squeeze is Real: How Latest CPI & PPI Reads are Tightening the Screws on the Housing Market Facebook X Linkedin The economic headlines have been buzzing with the latest Consumer Price Index (CPI) and Producer Price Index (PPI) reports. While these numbers might seem abstract, they have very real and significant implications for our […]
Connecticut Real Estate: How Current Market Momentum Could Impact Buyers & Sellers

About this Chart
The chart tracks the SPDR S&P 500 ETF's proximity to its 52-week volume-weighted average price (VWAP) (%) from 1999 to 2023. The vertical axis represents the percentage deviation from the VWAP, ranging between -30% to +24%, while the horizontal axis represents the timeline over nearly 25 years. Several key points in history are highlighted where the ETF experienced significant deviations, signaling moments of heightened volatility or substantial price corrections.
Analysis & Key Takeaways
- Volatility Patterns: The chart shows that the ETF has historically deviated substantially from its 52-week VWAP during periods of market distress, such as financial crises, economic downturns, or major geopolitical events. Large negative proximity percentages often indicate severe sell-offs.
- Market Cycles & Recovery: Each major deviation is followed by gradual recovery, implying that long-term investors have historically been rewarded for holding through volatility. This reinforces the idea that mean reversion plays a significant role in market behavior.
- Recent Trends: The ETF's current proximity to its VWAP may offer insights into whether the market is overheated or undervalued. If proximity is high, it may indicate strong bullish momentum, whereas a lower proximity suggests potential buying opportunities during temporary declines.
Investment Implications
For traders and investors, monitoring this metric helps in:
-
-
- Identifying periods of excessive optimism or pessimism.
- Spotting potential entry and exit points.
- Assessing broader market sentiment relative to historical trends.
-
What Does It Say About The Market?
Based on the latest data, the SPDR S&P 500 ETF's proximity to its 52-week VWAP suggests that the market is currently experiencing strong bullish momentum. The ETF's VWAP for May 12, 2025, was 580.42, with a standard deviation of ±1.38, and the current price is 582.85, indicating that the market is trading above its average price level.
Market Singal Interpretation
- Bullish Trend: The ETF's price being above its VWAP suggests continued buying pressure, meaning investors are confident in the market's upward trajectory.
- Momentum Strength: The deviation from VWAP is within a reasonable range, implying steady growth rather than extreme volatility.
- Potential Resistance: If the price continues to rise significantly above VWAP, it may signal overbought conditions, leading to a possible pullback or consolidation.
Investment Implications
- For traders: This could be a short-term buying opportunity, but caution is needed if the price moves too far above VWAP.
- For long-term investors: The trend reinforces market stability, suggesting that equities remain a strong asset class despite macroeconomic uncertainties.
What Today's Market Signals Mean for You - As a Real Estate Buyer, Seller, or Investor
As we watch the stock market’s bullish momentum, there’s a noticeable ripple effect on investor confidence and overall economic sentiment. While we can’t predict how long this trend will last, it’s worth considering how today’s market conditions could shape real estate decisions in Connecticut right now.
For Buyers: Why Acting Sooner Could Be Advantageous
With stocks climbing and economic optimism strong, buyer confidence is increasing—and that can lead to heightened competition for homes, potentially pushing prices higher.
Based on today’s trends, here’s what buyers should keep in mind:  Higher buyer demand could reduce inventory, making it harder to find the right home at a competitive price. Strong market sentiment suggests sellers may hold firm on pricing, limiting negotiating power for buyers who wait too long. Real estate remains a stable asset, even as other investments fluctuate, making it an attractive move in uncertain times.
For Sellers: Why Now Might Be the Right Time to List
While market trends can shift, current investor confidence supports a strong environment for selling. Those considering listing should weigh the benefits of striking while demand is high, rather than waiting and potentially facing different conditions.
Based on what we’re seeing now, sellers may benefit from: More motivated buyers—When financial markets are strong, buyers feel secure making large purchases, including homes. Listing at peak seasonal demand—With spring and summer bringing more buyers into the market, sellers listing now can take advantage of heightened interest. Avoiding future uncertainty—Stock market momentum can shift, and waiting too long to sell may mean facing different buyer attitudes and pricing dynamics later on.
Final Thoughts
While market momentum is strong right now, it’s impossible to say how long it will last. However, for buyers looking to secure a home before competition intensifies and sellers ready to capitalize on today’s buyer confidence, acting sooner rather than later could prove to be a smart move.
If you’re thinking about buying or selling, let’s talk about how these trends might impact your next move!
How to Position Your Portfolio as Bonds Sell Off & Housing Peaks
Navigating the Shift: Portfolio Positioning Guide Macro Strategy & Real Estate Navigating the Shift: How to Position Your Portfolio as Bonds Sell Off and Housing Hits Its Seasonal Peak Market Insights • Portfolio Strategy Guide As we cruise through mid-May, we are officially entering the absolute peak of the spring housing market. Sidewalks are busy, […]

The Wealth Preservation Pivot: Capitalizing on West Hartford’s Appreciation for a Low-Carry Lifestyle
The Wealth Preservation Pivot Capitalizing on West Hartford’s Appreciation to Secure a Low-Carry Lifestyle If you own property in West Hartford, you are likely sitting on significant equity. Demand for luxury real estate across Connecticut-and specifically in our high-density hubs-is on a steady rise. For many homeowners, this creates a psychological “waiting game”: Is this […]

West Hartford Real Estate: The “Sweet Spot” Price to Command a 7.4% Premium
Market Insights What is the right listing price to command the highest premium? A data-driven analysis of West Hartford sales (Last 60 Days). Avg. Over Asking $45,349 Median DOM 5 Days Highest Premium 36.7% In today’s West Hartford market, your list price is more than a number-it’s a strategic lever. Based on 61 recent closed […]

The Secret Weapon for Home Sellers: Why You Should Be Crashing Open Houses
Seller Strategy Know Your Competition: Why Savvy Sellers Should Scout Local Open Houses Selling a home is a competitive business. While it might feel counterintuitive to visit other listings when you’re busy prepping your own, attending local open houses is one of the most effective ways to gain a strategic advantage. It’s not about finding […]

Decoding the Hartford County Real Estate “Sweet Spot”: Volume vs. Intensity
Linkedin Facebook X Market Analysis: Decoding Buyer Demand in Hartford County By Alex Teplitskiy | Real Estate Insights In real estate, we often talk about the “sweet spot” of the market. To a casual observer, that might look like the price range where the most homes are selling. But for a savvy buyer or seller, […]
The #1 Hottest Market: Why Hartford Real Estate is Still a “Pressure Cooker”
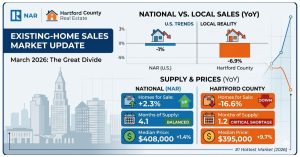
Facebook X Linkedin The Great Divide: Why Hartford is Defying National Real Estate Trends If you’ve been watching the national news lately, you might think the housing market is finally cooling off. Headlines from the National Association of Realtors (NAR) show inventory is rising and sales are slowing. But if you are looking for a […]
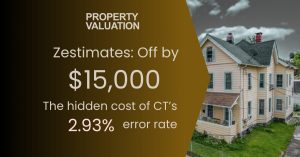
Is Zillow Accurate in Connecticut? The Truth About Active Listing Errors
Facebook X Linkedin Why “Zestimating” Your CT Home Could Cost You Thousands If you’re looking at homes in Connecticut, you’ve likely seen the Zestimate. It’s convenient and instant, but according to recent data, it is surprisingly off the mark for our unique local market. While Zillow’s algorithm performs well in states with high-density subdivisions like […]
Realtors bring a wealth of value to the table for both buyers and sellers in real estate transactions. Here’s a breakdown of the key areas where their expertise and services make a significant difference:
For Sellers:
- Pricing Expertise: Realtors have in-depth knowledge of the local market and can provide accurate and timely data analysis to help sellers determine the optimal listing price for their property. This helps sellers avoid overpricing or undervaluing their home.
- Marketing Power: Realtors have access to the Multiple Listing Service (MLS), a vast database of homes for sale that feeds all local area real estate brokerage websites. This ensures maximum exposure for the seller’s property to potential buyers. They also utilize various marketing strategies, including professional photography, social media, and networking, to attract qualified buyers.
- Negotiation Skills: Realtors are skilled negotiators who can help sellers get the best possible price and terms for their home. They can handle offers, counteroffers, and contingencies with expertise and professionalism.
- Legal and Paperwork Assistance: Selling a home involves a lot of complex paperwork and legal requirements. Realtors are well-versed in these aspects and can guide sellers through the process, ensuring compliance and minimizing potential risks.
- Streamlined Process: Realtors manage all the moving parts of a real estate transaction, from scheduling showings to coordinating inspections and appraisals. This saves sellers time, effort, and stress.
For Buyers:
- Property Search and Matching: Realtors can help buyers identify properties that meet their needs and budget. They have access to listings beyond what’s available to the public and can provide valuable insights into neighborhoods, schools, and amenities.
- Market Knowledge: Realtors keep track of market trends and can advise buyers on whether a property is priced fairly. They can also provide information about recent sales in the area and help buyers make informed decisions.
- Negotiation Skills: Realtors can help buyers negotiate offers and counteroffers, ensuring they get the best possible deal on their dream home. They can also help buyers navigate complex contingencies and closing procedures.
- Access to Professionals: Realtors often have a network of trusted professionals, such as lenders, inspectors, and contractors, that they can recommend to buyers. This can save buyers time and effort in finding reliable service providers.
- Guidance and Support: Buying a home can be a complex and emotional process. Realtors provide guidance and support throughout the entire journey, answering questions, addressing concerns, and helping buyers make confident decisions.
In summary, realtors bring a wide range of skills, knowledge, and resources to the table, making the process of buying or selling a home smoother, more efficient, and ultimately more successful for their clients.
Zombie Mortgages in Connecticut: What Every Homeowner (and Future Homeowner) Needs to Know

As your local West Hartford Realtor, I'm committed to keeping you informed about all aspects of the housing market – the exciting opportunities and the potential pitfalls. Lately, a chilling term has been circulating: "zombie mortgages." It might sound like a plot from a horror film, but for some Connecticut homeowners, this financial nightmare is a stark reality. Understanding what these are and how they can impact you is crucial, whether you're a current homeowner or dreaming of buying your first place here in our wonderful state.
What Are Zombie Mortgages? The Resurfacing of Old Debts
So, what exactly are these "zombie mortgages"? They are essentially mortgage debts that many homeowners believed were long gone, often second mortgages taken out during the housing boom of the mid-2000s. These were frequently "80/20 loans," where the second mortgage covered the remaining portion of the purchase price after the initial down payment.

Why Connecticut Homeowners Need to Know About Zombie Mortgages

Why should you, as a Connecticut homeowner or potential buyer, be aware of this? Because the resurgence of zombie mortgages can have significant consequences:
-
- Unexpected Financial Burden: Imagine suddenly facing a demand for tens of thousands of dollars on a debt you thought was settled years ago. This can derail your financial stability and future plans.
- Risk of Foreclosure: In the worst-case scenario, these debt collectors can initiate foreclosure proceedings to recover the debt, putting your home at risk.
- Impact on Property Value: Foreclosures in a neighborhood can negatively affect surrounding property values, impacting everyone in the community.
- Title Issues: If you're looking to sell your home in the future, the existence of an unreleased mortgage lien can create significant complications and delay or even prevent a sale.
- Peace of Mind: Understanding this potential issue empowers you to take proactive steps to protect yourself.
Zombie Mortgages: A Relevant Issue for the Connecticut Housing Market
This isn't just a national issue; it's particularly relevant right here in Connecticut. Several factors contribute to this:
Prevalence of Second Mortgages in CT: Like many areas during the housing boom, Connecticut saw many homeowners utilizing 80/20 loans. This creates a substantial pool of potentially affected properties.
Connecticut's Rising Foreclosure Rates: Recent data indicates that Connecticut has experienced a concerning rise in foreclosure rates and ranks among the highest in the nation (Commercial Record, December 2024; REsimpli, 2024). While not all are zombie mortgage cases, this trend underscores the vulnerability within our local housing market.
Connecticut had the second highest foreclosure rate, with 587 foreclosures out of 1,531,332 housing units, at a rate of one in every 2,609 households
(https://resimpli.com/blog/foreclosure-statistics/)
Resurfacing Zombie Mortgage Cases in Connecticut: As reported by Connecticut Inside Investigator (May 4, 2025), over 100 individuals in Connecticut have already faced these resurrected mortgage claims, with many more cases potentially in the legal system.
...According to an investigation by Connecticut Inside Investigator in May 2025, attorneys at the Connecticut Fair Housing Center have represented over 100 individuals in recent years facing what are known as 'zombie mortgages,' with around two dozen active cases at the time of the report (Connecticut Inside Investigator, May 4, 2025).
(https://insideinvestigator.org/zombie-mortgage-decades-old-contracts-come-back-to-haunt-borrowers/)
Impact of Connecticut Property Value Recovery: The recovery and growth of property values in our area make these older debts more attractive to pursue for debt collectors.
Red Flags for Connecticut Homeowners: What to Look for with Zombie Mortgages

While you can't change the past, there are steps Connecticut homeowners can take to prepare:
- Organize Your Mortgage and Refinance Records: Gather and organize all past mortgage documents, refinance paperwork, and foreclosure-related correspondence.
- Stay Informed on Connecticut Real Estate News: Keep up-to-date on local real estate news and any legal developments related to mortgage issues in Connecticut.
- Know Your Rights Under Connecticut Law: Familiarize yourself with Connecticut's foreclosure laws and debt collection practices.
- Review Your Connecticut Title Insurance Policy: If you purchased your home years ago, review your title insurance policy to understand its coverage.
What to Do If You Face a Zombie Mortgage Claim in Connecticut: Contact Your Realtor and Legal Counsel

If you find yourself contacted about a "zombie mortgage" in Connecticut, it's crucial to act quickly and cautiously:
- Do Not Panic: Take a deep breath and avoid making any immediate payments or agreements.
- Request Documentation of the Old Debt: Demand detailed documentation of the alleged debt, including the original loan agreement, payment history, and proof of ownership by the current claimant.
3. Seek Legal Advice Immediately in Connecticut: Contact a qualified real estate attorney in Connecticut with experience in foreclosure defense. They can advise you on your rights and potential legal strategies. The Connecticut Fair Housing Center (Connecticut Inside Investigator, May 4, 2025) is also a valuable resource.
4. Contact Your West Hartford Realtor for Guidance: Reach out to me, your trusted West Hartford real estate professional. I can help you understand the potential implications for your property and connect you with reputable legal resources in our area. While I'm not a legal expert, my market knowledge and network can be invaluable in navigating these complex situations.
Protecting Connecticut Homeowners: Your Trusted West Hartford Realtor Resource
The emergence of zombie mortgages in Connecticut is a serious issue that homeowners need to be aware of. By understanding the history, knowing what to look for, and taking proactive steps, you can protect yourself. As your dedicated Realtor in West Hartford, I am here to be a resource for you.
Whether you're buying, selling, or simply seeking information about the local housing market, please don't hesitate to reach out.
Let's work together to ensure your real estate journey is smooth and secure.
Navigating the Shift: Portfolio Positioning Guide Macro Strategy & Real Estate Navigating the Shift: How […]
The Wealth Preservation Pivot Capitalizing on West Hartford’s Appreciation to Secure a Low-Carry Lifestyle If […]
Market Insights What is the right listing price to command the highest premium? A data-driven […]
Seller Strategy Know Your Competition: Why Savvy Sellers Should Scout Local Open Houses Selling a […]
Linkedin Facebook X Market Analysis: Decoding Buyer Demand in Hartford County By Alex Teplitskiy | […]
Facebook X Linkedin The Great Divide: Why Hartford is Defying National Real Estate Trends If […]


Hartford Office Space for Lease: Finding Tenant Opportunities in 2025
The Hartford office space sector is currently navigating a dynamic period. While overall vacancy rates in Greater Hartford hover around the 19-24% mark, presenting a landscape ripe with opportunity for savvy tenants, the nuances within different submarkets paint a more detailed picture. For businesses both rooted in Hartford County and those looking to establish a presence here, understanding these dynamics is key to making strategic real estate decisions.
The State of Play: Understanding the Hartford Office Space Sector
The reality is, Hartford's office market has seen its share of shifts. Factors such as the evolving landscape of remote work and broader economic trends have contributed to the current vacancy levels. While the market is seeing a "flight to quality," with tenants often prioritizing modern, well-amenitized spaces, this also leaves a significant amount of inventory available across the region.
Within this broader context, Downtown Hartford presents its own set of circumstances. While still the central business hub, it often experiences higher vacancy rates compared to its suburban counterparts. Recent absorption trends have been varied, and the challenge of revitalizing older office buildings remains a key consideration.
A Tale of Two Suburbs: Contrasting West Hartford and Glastonbury
In stark contrast to some of the challenges faced in downtown Hartford, the suburban markets of West Hartford and Glastonbury consistently demonstrate a different story.
West Hartford stands out for its vibrant town center, a magnet for a diverse range of businesses. Its blend of upscale amenities, a thriving lifestyle appeal, and a strong sense of community makes it a highly desirable location. Businesses in professional services, smaller regional offices, and those prioritizing employee quality of life are often drawn to West Hartford's stability and lower vacancy rates. Recent developments and a consistent demand contribute to its resilience.
Glastonbury, on the other hand, offers a different kind of appeal. Known for its well-maintained corporate parks and excellent accessibility to major highways, it attracts a range of industries, including insurance and technology. The often more campus-like settings and strategic location make it an attractive alternative to the downtown core for companies seeking a blend of accessibility and a less urban environment.
In essence, while Greater Hartford offers a tenant-favorable market, West Hartford and Glastonbury showcase stronger occupancy and a different set of locational advantages compared to downtown. Understanding these submarket distinctions is crucial for any business considering office space in the region.
The Silver Lining: Why the Hartford Tenant's Market Presents Opportunities
The current environment, characterized by higher vacancy rates, presents a significant window of opportunity for both local and out-of-state businesses looking for office space in Hartford County.
For Local Players: Now is the time to strategically evaluate your current office situation. If you're a local business looking to relocate or expand, the current market dynamics offer considerable leverage. You have the power to negotiate lower rents, secure more generous tenant improvement allowances, and potentially access higher-quality spaces that might have been previously out of reach. Even within Hartford itself, the "flight to quality" means that prime locations with modern amenities are now more attainable. Imagine a local accounting firm finally securing that prestigious downtown address with customized build-outs, significantly enhancing their client image and employee satisfaction – a scenario more feasible in today's tenant-centric market.
For Out-of-State Players: Hartford County represents an increasingly attractive entry point into the New England market. Compared to more expensive and competitive markets like Boston or New York, Hartford offers a potentially cost-effective location for establishing a regional office or expanding your national footprint. The region boasts a skilled and educated workforce, providing access to talent at competitive costs. Furthermore, Hartford's strategic location within Connecticut and its proximity to major transportation networks make it a logical hub for regional operations. By capitalizing on the current tenant's market, out-of-state companies can position themselves for long-term growth as the Hartford market potentially strengthens. Consider a Boston-based tech company finding significantly more affordable and spacious office options in Glastonbury, allowing for team expansion without the premium costs associated with the Greater Boston area.
Strategic Advantage: A SWOT Analysis of the Hartford Office Market (for Tenants)
To further illustrate the opportunities, let's consider a SWOT analysis from a tenant's perspective:
- Strengths:
High vacancy rates: Provides significant negotiating power.
Attractive lease terms: Potential for lower rents and increased tenant improvement allowances.
Diverse inventory: Availability of various office spaces, including high-quality options across different submarkets.
Strategic location: Central within Connecticut with good transportation links.
- Weaknesses:
Concerns about long-term demand and potential oversupply in certain areas.
Some older inventory might require significant upgrades.
Perception challenges associated with specific locations (e.g., downtown).
- Opportunities:
Securing prime locations at competitive rates.
Negotiating long-term leases with favorable conditions.
Contributing to the potential revitalization of areas like downtown Hartford.
Accessing a skilled workforce.
- Threats:
Potential for future rent increases as the market recovers.
Uncertainty in long-term economic conditions.
Continued trend towards remote work impacting future space needs (though this also contributes to current vacancies).
Conclusion: Your Partner in Navigating the Hartford Office Market
The Hartford office landscape presents a unique window of opportunity for businesses seeking space. Whether you are a local company ready to elevate your operations or an out-of-state organization looking for a strategic foothold in New England, understanding the nuances of each submarket and leveraging the current tenant's market is crucial.
As your dedicated real estate expert in Hartford County, I am here to provide the insights and guidance you need to navigate this evolving market effectively. From identifying the ideal location in West Hartford, Glastonbury, or even a revitalizing pocket of downtown Hartford, to negotiating the most favorable lease terms, I am committed to helping you find the perfect office space to meet your business objectives.
Ready to capitalize on the opportunities within the Hartford office market? Contact me today for a personalized consultation, and let's find the space that will propel your business forward.

Navigating the Shift: Portfolio Positioning Guide Macro Strategy & Real Estate Navigating the Shift: How to Position Your Portfolio as Bonds Sell Off and Housing […]
Read MoreThe Wealth Preservation Pivot Capitalizing on West Hartford’s Appreciation to Secure a Low-Carry Lifestyle If you own property in West Hartford, you are likely sitting […]
Read MoreMarket Insights What is the right listing price to command the highest premium? A data-driven analysis of West Hartford sales (Last 60 Days). Avg. Over […]
Read MoreSeller Strategy Know Your Competition: Why Savvy Sellers Should Scout Local Open Houses Selling a home is a competitive business. While it might feel counterintuitive […]
Read MoreLinkedin Facebook X Market Analysis: Decoding Buyer Demand in Hartford County By Alex Teplitskiy | Real Estate Insights In real estate, we often talk about […]
Read MoreFacebook X Linkedin The Great Divide: Why Hartford is Defying National Real Estate Trends If you’ve been watching the national news lately, you might think […]
Read MoreFacebook X Linkedin Why “Zestimating” Your CT Home Could Cost You Thousands If you’re looking at homes in Connecticut, you’ve likely seen the Zestimate. It’s […]
Read MoreFacebook X Linkedin Is Your Tax Bill Too High? Breaking Down the Latest ATTOM Data If you’ve opened your mail recently and felt a bit […]
Read MoreFacebook X Linkedin The Tale of Two Connecticuts: Decoding the Market Trends in Hartford vs. Fairfield Counties As we move through the 2026 real estate […]
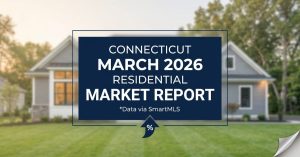
Read MoreFacebook X Linkedin Connecticut Real Estate Market Pulse March 2026 Report The Connecticut residential market continues to show remarkable resilience as we head into the […]
Read MoreThe Pulse of Hartford County Buyers in April 2025


Key Observations for April 2025:
Number of Sales: There were 602 single-family home sales in Hartford County. This represents a decrease of 5.8% compared to April 2024.
Median Sale Price: The median sale price was $370,000, showing a significant increase of 11.8% from the previous year.
Percentage Over or Under Asking Price: On average, homes sold for 5.3% above the original asking price. This is a slight decrease of 1.0% compared to April 2024.

Key Market Dynamics: Fewer Sales, Higher Prices Amidst Shifting Inventory
The April 2025 data for Hartford County reveals a nuanced picture of buyer demand. While the number of new listings (supply) saw a slight decrease of 5.7% compared to last year, the number of new pendings (demand) experienced a more significant drop of 26.5%. This decrease in pending sales, coupled with the earlier observation of fewer overall sales but a notably higher median price, suggests a market where buyer activity, in terms of initiating new contracts, has cooled somewhat. However, the elevated median sale price indicates that the homes currently selling are still commanding strong values. To truly understand the dynamics at play and the specific segments where buyer demand remains robust, it's essential to analyze what types of properties are successfully moving in this evolving market. Let's delve deeper into the sales data by price range to pinpoint where buyer interest is concentrated and where opportunities might lie for both buyers and sellers.
Where the Buyers Are: Sales Volume by Price Point in Hartford County

Highest Demand: The $200k - $399k price range saw the most sales (298), indicating strong buyer activity in this segment.
Significant Interest: The $400k - $599k range also experienced a substantial number of sales (154).
Price & Size Correlation: Generally, average square footage increases with the price range.
Sweet Spot Consideration: Sellers with homes in the average square footage of the high-demand price ranges may find a larger pool of interested buyers.
Luxury Market: Fewer sales occur at higher price points ($800k+), but these homes offer significantly more square footage.
Strategic Pricing: Aligning Your Hartford County Home with Buyer Demand (by Sqft)
Understanding where the strongest buyer demand lies in Hartford County, as clearly illustrated by the sales volume in the $200k - $399k and $400k - $599k price ranges, is crucial for sellers. If your home's square footage aligns with the average seen in these active brackets (around 1,417 sqft and 2,072 sqft respectively), strategic pricing within these ranges can attract a larger pool of motivated buyers.
Conversely, sellers of larger homes need to be mindful of the potentially smaller buyer pool in higher price tiers. While your square footage might be greater, overpricing significantly beyond the typical range for active segments could lead to longer days on market.
For example, if you have a home with around 1,500 sqft, pricing it competitively within the $200k - $399k range, based on its condition and features, is likely to generate more interest than pushing it into the $400k+ range solely based on size, potentially missing the most active buyer segment.
Ultimately, a balanced approach that considers both your home's size and the prevailing buyer demand within specific price ranges in Hartford County will lead to a more effective pricing strategy and a potentially quicker sale.
Insights on Days on Market

The Median Days on Market (DOM) across different price ranges in Hartford County provides further valuable insights into buyer urgency and market heat.
Notice that the $400k - $599k range has one of the lowest median DOM at just 7 days. This reinforces the strong and efficient buyer demand we saw in the sales volume data. Homes priced competitively in this range are moving very quickly.
Interestingly, the $1.4M - $1.99M range shows a significantly higher median DOM of 12 days, despite a moderate number of sales. This could indicate a more discerning buyer pool at this price point, or perhaps a need for more precise pricing.
The lower price ranges (below $400k) also show relatively quick movement, suggesting strong interest from first-time buyers or those seeking more affordable options
Sellers should pay close attention to the DOM trends in their specific price range. A higher DOM might signal a need to re-evaluate pricing or property condition to align with buyer expectations.
General Connecticut Example:
Let's consider a typical single-family home or condo in Connecticut with approximately 1,912 sqft (a size that falls within the average range observed in the more active price points). Based on the Hartford County data, homes in the $200k - $599k range, where we see the highest sales volume, have an average square footage between roughly 1,400 and 2,100 sqft.
Therefore, if you have a 1,912 sqft property, your initial pricing strategy should heavily consider the sweet spots of buyer demand in these price brackets. Overpricing it significantly above $600k might place it in a segment with fewer buyers and potentially longer days on market, even though the size might seem to warrant a higher price.
To attract the most interest, a careful analysis of recent comparable sales of similar-sized properties within the $200k - $599k range in your specific location is crucial. Factors like condition, features, and exact location will then fine-tune the optimal listing price to meet buyer expectations and tap into the strongest demand.
Average % Closed Over or Under Asking Price

As you consider pricing, this chart illustrates the average percentage homes are selling above or below their asking price across different price ranges in Hartford County. Notice that the $400k - $599k range, which we identified as a high-demand segment, also sees homes selling for an average of 7.24% above asking. This indicates strong buyer competition and suggests that well-priced homes in this range have the potential to sell quickly and above list price. Conversely, the lower price range (0 - $199k) sees homes selling slightly below asking on average, which could inform pricing strategies for properties in that segment.
Transitioning to Local Expertise: The Unique Dynamics of West Hartford:
While the previous example provides a general framework for pricing in Connecticut, the real estate landscape can vary significantly from town to town. To illustrate this, let's focus specifically on West Hartford, a market with its own distinct characteristics and buyer preferences.
| Price | # of Sales | Ave Sqft | Median DOM | Average % Closed Over or Under Asking |
|---|---|---|---|---|
| $200k-$399k | 10 | 1,379 | 11 | -0.13% |
| $400k-$599k | 13 | 2,069 | 6 | 10.20% |
| $600k-$799k | 10 | 2,719 | 5 | 12.34% |
| $800k-$999k | 4 | 2,954 | 5 | 10.85% |
| $1M-$1.19M | 3 | 3,624 | 6 | 11.13% |
| $1.4M-$1.99M | 2 | 6,051 | 4 | 10.00% |
This detailed breakdown clearly illustrates the varying levels of demand, speed of sale, and pricing dynamics within different segments of the West Hartford market. For instance, the strong "above asking" percentages in the higher price ranges, coupled with quick DOM, highlight the competitive nature of these segments in West Hartford, while the lower price range shows a different trend.
The Importance of Local Expertise
As we've seen, the Hartford County real estate market, and even specific towns within it like West Hartford, exhibit unique characteristics. The data clearly demonstrates that pricing a home effectively requires a nuanced understanding of these local dynamics. This is where the expertise of a knowledgeable Realtor becomes invaluable.
Pricing a Home in Today's West Hartford Market: A Practical Example
Let's consider a 2,423 sqft home in West Hartford, which is the average size of homes currently being sold in the town. Here's how I, as a West Hartford real estate expert, would approach pricing this property: I'd first look at the 'West Hartford Market Data Table' to see that the average square footage of homes sold in the $600k-$799k range is around 2,719 sqft. This tells me that there's buyer activity in this range for homes of this size.
However, I wouldn't price it at the very top of that range without further analysis. I'd then conduct a detailed comparative market analysis (CMA), examining recent sales of similar-sized homes in the same neighborhood, taking into account the home's specific condition, features (like a renovated kitchen or a large backyard), and its precise location within West Hartford. This ensures the home is priced competitively to attract the most qualified buyers while maximizing the seller's return.
In Conclusion: Navigating Hartford County's Dynamic Market
The April 2025 data for Hartford County reveals a market with both opportunities and complexities. While overall sales have seen a slight decrease, strong pricing power persists, driven by buyer demand that varies across price points and, crucially, from town to town. As we've seen, even within Hartford County, a town like West Hartford exhibits its own unique dynamics, with specific price ranges attracting different buyer segments and showing varying levels of competition.
For sellers, this means that strategic pricing, informed by a deep understanding of local market nuances, is paramount. Overpricing can lead to missed opportunities, while a well-informed strategy, tailored to the specific characteristics of your property and its location, can maximize your return.
For buyers, this data underscores the importance of being prepared and working with a knowledgeable agent who can provide hyper-local insights. The market remains competitive, and understanding the subtle differences between towns and neighborhoods is essential for making informed decisions and securing the right home.
Whether you're a buyer or seller in Hartford County, particularly in the West Hartford area, I am here to provide you with the expertise and personalized guidance you need to navigate this dynamic market successfully. My in-depth knowledge of local trends, pricing dynamics, and buyer behavior will ensure that you're positioned for success. Contact me today to discuss your real estate goals and how I can help you achieve them.
Navigating the Shift: Portfolio Positioning Guide Macro Strategy & Real Estate Navigating the Shift: How to Position Your Portfolio as Bonds Sell Off and Housing […]
The Wealth Preservation Pivot Capitalizing on West Hartford’s Appreciation to Secure a Low-Carry Lifestyle If you own property in West Hartford, you are likely sitting […]
Market Insights What is the right listing price to command the highest premium? A data-driven analysis of West Hartford sales (Last 60 Days). Avg. Over […]
Seller Strategy Know Your Competition: Why Savvy Sellers Should Scout Local Open Houses Selling a home is a competitive business. While it might feel counterintuitive […]
Linkedin Facebook X Market Analysis: Decoding Buyer Demand in Hartford County By Alex Teplitskiy | Real Estate Insights In real estate, we often talk about […]
Facebook X Linkedin The Great Divide: Why Hartford is Defying National Real Estate Trends If you’ve been watching the national news lately, you might think […]
Facebook X Linkedin Why “Zestimating” Your CT Home Could Cost You Thousands If you’re looking at homes in Connecticut, you’ve likely seen the Zestimate. It’s […]
Facebook X Linkedin Is Your Tax Bill Too High? Breaking Down the Latest ATTOM Data If you’ve opened your mail recently and felt a bit […]

Facebook X Linkedin The Tale of Two Connecticuts: Decoding the Market Trends in Hartford vs. Fairfield Counties As we move through the 2026 real estate […]
Facebook X Linkedin Connecticut Real Estate Market Pulse March 2026 Report The Connecticut residential market continues to show remarkable resilience as we head into the […]
What Happened in Connecticut's Single Family Home Market This April?

Key Observations for April 2025
Number of Sales: There were 1,794 single-family home sales in April 2025. This represents a decrease of 4.2% compared to the previous year (April 2024).
Total Sales Volume: The total dollar volume of single-family home sales in April 2025 reached $1.19 billion. This shows a increase of 2.2% from the previous year (April 2024).
Analyzing the Pace and Scale of Home Sales
April 2025 shows a significant increase in both the number of sales and total volume compared to the preceding winter months (December 2024 - February 2025), indicating the typical spring market rebound.
The chart clearly illustrates the typical seasonal trends in real estate. We see a noticeable peak in both the number of sales and total volume during the late spring and summer months (roughly May through September) of both 2024 and 2023. Activity tends to dip in the late fall and winter.

Key Observations
Home Prices are Significantly Higher: In April 2025, the middle price that a single-family home sold for in Connecticut was $458,000. This is a substantial $33,000 increase compared to the median sale price in April of last year (2024).
Cost per Square Foot is Also Up: When looking at the price per square foot, the middle value was $289 in April 2025. This is $16.01 more per square foot than what it was in April 2024.
Looking at How Prices Have Changed Over the Last Three Years
Prices Follow a Predictable Pattern Each Year: If you look at 2023, 2024, and 2025, you can see that home prices tend to be lower at the beginning of the year (winter), then they gradually rise during the spring and reach their highest point around late spring or summer. After that, they tend to slowly decrease again towards the end of the year.
Home Values Have Been Steadily Increasing: When you compare the price lines for each year (2023, 2024, and 2025), it's clear that home prices, at any given time of the year, have generally been higher than they were at the same time in the previous year. This shows a consistent trend of increasing home values in Connecticut.
The Increase in Prices Seems Stronger This Year: The difference in price between the 2024 line and the 2025 line, especially during the spring months, suggests that home prices have been rising more quickly in 2025 compared to the rate of increase we saw between 2023 and 2024 during the same period.
In simpler terms:
-
- Homes in Connecticut sold for a lot more money in April 2025 than they did in April 2024.
- The price for each square foot of a home also went up significantly.
- Over the past three years, home prices tend to go up and down with the seasons, but overall, they have been consistently getting more expensive each year, and the increase seems particularly noticeable this year.

Key Metrics for April 2025
Average % Closed vs. Asking Price: The average percentage that homes closed for compared to their original asking price was 3.70% above asking. This is a slight increase of 0.04% from the previous year (April 2024). This suggests that, on average, buyers were willing to pay slightly more than the listed price to secure a home.
Days on Market (DOM) - Median: The median number of days a home stayed on the market before being sold was 15 days. This is a decrease of 1 day compared to the median DOM in April 2024. This indicates that homes were selling slightly faster this April than last year.
Understanding the Strength of the Buyer Pool
Average % Over Asking Trend: The blue line shows the average percentage homes sold above their asking price. We see a clear seasonal pattern here as well:
Peak Demand in Spring/Summer: The highest percentages above asking tend to occur in the late spring and summer months (May-August). This is typical when buyer competition is often higher.
Lower Demand in Fall/Winter: The percentage above asking generally decreases in the fall and winter, suggesting less intense buyer competition during those times.
April 2025 Shows Strong Demand: The 3.70% above asking in April 2025 is a significant jump from the winter lows and indicates strong buyer interest as the spring market picks up.
Days on Market (DOM) Trend: The black line illustrates the median number of days homes are listed before selling.
Shorter DOM in Spring/Summer: Similar to the "Average % Over Asking," the DOM tends to be lower during the spring and summer months, meaning homes sell more quickly.
Longer DOM in Fall/Winter: The DOM generally increases in the fall and winter as the market cools down.
April 2025 Shows Quick Sales: The median DOM of 15 days in April 2025 is relatively low, indicating that desirable homes are being snapped up quickly.
Strong Prices and Quick Sales: The data from this chart reinforces the trends we saw earlier. The higher median sale prices and the willingness of buyers to pay above asking price (as shown by the "Average % Closed vs. Asking") are consistent with a market where demand is strong.
Lower Inventory Could Be a Factor: The fact that homes are selling slightly faster (lower DOM) and often above asking could be a sign of relatively tight inventory. When there aren't many homes available, buyers compete more aggressively, driving up prices and reducing the time homes stay on the market.
A Look Back and What's Ahead for Buyers and Sellers
The April 2025 data confirms what we're seeing on the ground in the Connecticut single-family home market, especially right here in West Hartford: the dynamic we experienced last year is not only continuing but is doing so at a premium. We're observing a clear uptrend in both buyer demand and, significantly, in sale prices.
For Sellers: Take note – the historically strong selling months are ahead! If you've been considering a move this year, now is the time to strategically plan and act quickly to catch this wave of heightened buyer interest and potentially achieve top dollar for your property.
For Buyers: With homes selling briskly and often above asking, being prepared is paramount. Get your financing in order and be ready to act decisively when you find a home that meets your needs. Opportunities are out there, but speed and a well-informed strategy are key to success.
Whether you're a seller looking to maximize your return in this favorable climate or a buyer navigating this competitive market, I'm here to guide you every step of the way.
Let's leverage these trends to your advantage.
Contact me today for personalized advice and expert representation to achieve your real estate goals.

My Blog Posts
Navigating the Shift: Portfolio Positioning Guide Macro Strategy & Real Estate Navigating the Shift: How to Position Your Portfolio as Bonds Sell Off and Housing Hits Its Seasonal Peak Market Insights • Portfolio Strategy Guide As we cruise through mid-May, we are officially entering the absolute peak of the spring housing market. Sidewalks are busy, […]
The Wealth Preservation Pivot Capitalizing on West Hartford’s Appreciation to Secure a Low-Carry Lifestyle If you own property in West Hartford, you are likely sitting on significant equity. Demand for luxury real estate across Connecticut-and specifically in our high-density hubs-is on a steady rise. For many homeowners, this creates a psychological “waiting game”: Is this […]
Market Insights What is the right listing price to command the highest premium? A data-driven analysis of West Hartford sales (Last 60 Days). Avg. Over Asking $45,349 Median DOM 5 Days Highest Premium 36.7% In today’s West Hartford market, your list price is more than a number-it’s a strategic lever. Based on 61 recent closed […]
Seller Strategy Know Your Competition: Why Savvy Sellers Should Scout Local Open Houses Selling a home is a competitive business. While it might feel counterintuitive to visit other listings when you’re busy prepping your own, attending local open houses is one of the most effective ways to gain a strategic advantage. It’s not about finding […]
Linkedin Facebook X Market Analysis: Decoding Buyer Demand in Hartford County By Alex Teplitskiy | Real Estate Insights In real estate, we often talk about the “sweet spot” of the market. To a casual observer, that might look like the price range where the most homes are selling. But for a savvy buyer or seller, […]
Facebook X Linkedin The Great Divide: Why Hartford is Defying National Real Estate Trends If you’ve been watching the national news lately, you might think the housing market is finally cooling off. Headlines from the National Association of Realtors (NAR) show inventory is rising and sales are slowing. But if you are looking for a […]
Facebook X Linkedin Why “Zestimating” Your CT Home Could Cost You Thousands If you’re looking at homes in Connecticut, you’ve likely seen the Zestimate. It’s convenient and instant, but according to recent data, it is surprisingly off the mark for our unique local market. While Zillow’s algorithm performs well in states with high-density subdivisions like […]
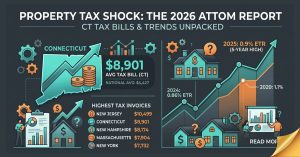
Facebook X Linkedin Is Your Tax Bill Too High? Breaking Down the Latest ATTOM Data If you’ve opened your mail recently and felt a bit of “tax shock,” you aren’t alone. The latest annual report from ATTOM Data Solutions, released yesterday (April 9, 2026), confirms that property taxes are reaching historic highs across the country-and […]
Facebook X Linkedin The Tale of Two Connecticuts: Decoding the Market Trends in Hartford vs. Fairfield Counties As we move through the 2026 real estate season, many of my clients are asking the same question: “Is it the right time to move, or should I wait?” The truth is, there isn’t just one “Connecticut Market.” […]
Facebook X Linkedin Connecticut Real Estate Market Pulse March 2026 Report The Connecticut residential market continues to show remarkable resilience as we head into the second quarter of 2026. While sales volume has adjusted seasonally, pricing power remains firmly in the hands of sellers.Key Takeaway: Despite a 6.3% dip in the total number of sales […]
Where to Find Your Next Connecticut Multifamily Investment Property
Top 10 Most Active Markets For Multi-Family Properties
| City | $149K-$648K | $649K-$1,148K | >$1,149K | Total |
| Bridgeport | 19 | 16 | 10 | 45 |
| Hartford | 34 | 2 | 6 | 42 |
| New Britain | 13 | 4 | 2 | 19 |
| New Haven | 65 | 6 | 9 | 80 |
| Norwalk | 1 | 5 | 8 | 14 |
| Norwich | 19 | 2 | 21 | |
| Stamford | 3 | 9 | 12 | |
| Torrington | 13 | 3 | 16 | |
| Waterbury | 27 | 1 | 5 | 33 |
| West Haven | 11 | 2 | 13 | |
| Grand Total | 202 | 37 | 56 | 295 |
New Haven
| Price Range | Total Listings |
| $149,000-$248,999 | 2 |
| $249,000-$348,999 | 14 |
| $349,000-$448,999 | 25 |
| $449,000-$548,999 | 17 |
| $549,000-$648,999 | 7 |
| $649,000-$748,999 | 4 |
| $749,000-$848,999 | 2 |
| >$849,000 | 9 |
| Grand Total | 80 |
Home to the prestigious Yale University, New Haven is a vibrant city brimming with intellectual energy and a rich cultural scene. This dynamic environment, coupled with a significant student and professional population, creates a consistent demand for multifamily housing, making it an attractive market for investors.
Bridgeport
| Price Range | Total Listings |
| $349,000-$448,999 | 7 |
| $449,000-$548,999 | 7 |
| $549,000-$648,999 | 5 |
| $649,000-$748,999 | 9 |
| $749,000-$848,999 | 7 |
| >$849,000 | 10 |
| Grand Total | 45 |
Bridgeport, Connecticut's fifth-largest city, offers a unique blend of urban convenience and coastal charm along the Long Island Sound. With a diverse population and ongoing development, Bridgeport presents intriguing opportunities for multifamily investors looking for value and potential growth within the Connecticut market.
Hartford
| Price Range | Total Listings |
| $249,000-$348,999 | 8 |
| $349,000-$448,999 | 13 |
| $449,000-548,999 | 8 |
| $549,000-648,999 | 5 |
| $649,000-748,999 | 2 |
| >$849,000 | 6 |
| Grand Total | 42 |
Ready to explore the multifamily investment potential in Bridgeport, New Haven, or other thriving Connecticut towns? My in-depth knowledge of the local market and access to the latest listings can help you identify the perfect property to meet your investment goals. Contact me today for a personalized consultation and let's discuss how I can assist you in finding your next successful multifamily venture.

Alex Teplitskiy
(860) 543-9417
REALTOR®
Century21 AllPoints Realty
1001 Farmington Avenue
West Hartford, CT
Licensed in Connecticut
alex.teplitskiy@gmail.com
My other blog posts
Navigating the Shift: Portfolio Positioning Guide Macro Strategy & Real Estate Navigating the Shift: How to Position Your Portfolio as Bonds Sell Off and Housing […]
The Wealth Preservation Pivot Capitalizing on West Hartford’s Appreciation to Secure a Low-Carry Lifestyle If you own property in West Hartford, you are likely sitting […]
Market Insights What is the right listing price to command the highest premium? A data-driven analysis of West Hartford sales (Last 60 Days). Avg. Over […]
Seller Strategy Know Your Competition: Why Savvy Sellers Should Scout Local Open Houses Selling a home is a competitive business. While it might feel counterintuitive […]
How a Clear Goal Transforms Obstacles into Minor Setbacks

There I was, on a mission. Not a grand, world-saving mission, mind you, but a slightly less glamorous one: heading out the door to film a promotional video for our upcoming Realtor's Education Day. Shoes in hand, I went to slip them on, only to be met with the age-old nemesis of undone shoelaces.
You know the drill. The aglet – that helpful little plastic tip – had gone rogue, leaving a frayed mess that refused to be coaxed through the tiny eyelet. I pushed, I wiggled, I even muttered a few choice words under my breath. Nothing.
Then, in a moment of what I'll generously call ingenuity, I thought, "Why am I trying to push this mangled end through? What if I try to hook the other end and pull it through instead?" And wouldn't you know it, with a bit of maneuvering, it worked!


As I triumphantly laced up my shoe, a funny thought struck me. It echoed so much of the advice we hear about motivation. We're often told by self-help gurus and inspiring speakers that we need to find what "pulls" us – our passion, our intrinsic drive – or what "pushes" us – external pressures, looming deadlines – to achieve our goals.
But in that shoelace moment, it hit me: all the pushing and pulling in the world wouldn't have mattered if I didn't need to put my shoes on and go somewhere. The urgency of having a destination – the video shoot – was the fundamental reason I was even bothering with the frustrating shoelace in the first place.
It was a bit of an "aha!" moment. We spend so much time trying to figure out what intrinsically motivates us or how to respond to external pressures, that we sometimes overlook the simple power of having a clear and urgent "place to be."


Think about it. How often have you felt uninspired to start a task, only to find a sudden surge of energy when a deadline loomed? The "push" of the deadline became effective precisely because you needed to deliver something by a certain time – you had a destination.
It's like planning a road trip. You can have the most powerful engine (your internal drive) and the most compelling scenery along the way (external motivators), but without a destination in mind, you're just driving aimlessly.
So, before you embark on the quest to discover what truly moves you, perhaps it's worth first defining where you need to be. Make that destination urgent, make it non-negotiable, and you might just find that the "push" and "pull" factors become a whole lot more effective.
Maybe the secret to untangling our biggest goals starts with simply knowing where we absolutely need to go and creating that essential sense of urgency. After all, even a stubborn shoelace will eventually cooperate when you absolutely, positively have to get out the door.
West Hartford Property Taxes: What the Mill Rate Hike Means for You

West Hartford homeowners will see an increase in their property taxes in the upcoming fiscal year (July 1, 2025 - June 30, 2026) due to the adoption of a higher mill rate. The West Hartford Town Council approved a budget that sets the mill rate for real and personal property at 44.78 mills, a 5.74% increase from the current rate of 42.35 mills. This decision, made on April 22, 2025, will directly impact the amount of property taxes paid by homeowners in the town.
What is a Mill Rate?
A mill rate represents the amount of property tax for every $1,000 of assessed property value. The new mill rate of 44.78 mills means that for every $1,000 of your home's assessed value, you will pay $44.78 in property taxes.


Understanding Assessed Value
In Connecticut, property taxes are calculated using the assessed value, which is 70% of the fair market value determined during the town's most recent revaluation. West Hartford conducts a revaluation of all real estate every five years, as mandated by Connecticut State Statutes. The next revaluation is scheduled for October 1, 2026. The assessed value remains constant until the next revaluation, even if the actual market value of a property changes in the interim.
Calculating Your Property Tax:
- Determine your home's assessed value (70% of the value from the last revaluation).
- Multiply the assessed value by the mill rate (44.78 for 2025-2026).
- Divide by 1,000: The result is your estimated annual property tax bill.

Example (Illustrative - Using a hypothetical assessed value):
Let's say your home's assessed value is $350,000 (based on the last revaluation)
Tax Calculation: ($350,000 / 1,000) * 44.78 = $15,673.00
Motor Vehicle Tax Cap:
It's important to note that the mill rate for motor vehicles in West Hartford is capped by the state and will remain at 32.46 mills.

Reassessment Schedule:
As mentioned, the next town-wide revaluation is scheduled for October 1, 2026. This process will update the fair market values of all properties and subsequently impact their assessed values for future tax years. The town is currently in the process of taking photos of all properties in preparation for this revaluation.
Navigating the West Hartford Real Estate Market
Changes in property taxes and the anticipation of a future revaluation can influence homeowners' decisions about their properties. If you're considering selling your home in West Hartford and want to understand the current market dynamics, including the impact of mill rates and the upcoming reassessment, I'm here to help.
As a local Realtor, I can provide you with a comprehensive market analysis based on current conditions and help you navigate the potential implications of the upcoming revaluation. Let's connect to discuss your options and make informed decisions in the evolving West Hartford market.
Navigating the Shift: Portfolio Positioning Guide Macro Strategy & Real Estate Navigating the Shift: How […]
The Wealth Preservation Pivot Capitalizing on West Hartford’s Appreciation to Secure a Low-Carry Lifestyle If […]
Market Insights What is the right listing price to command the highest premium? A data-driven […]
Seller Strategy Know Your Competition: Why Savvy Sellers Should Scout Local Open Houses Selling a […]


© 2026 MoxiWorks
© CENTURY 21 2023 - 2024. All rights reserved. CENTURY 21®, C21® and the CENTURY 21 Logo are registered service marks owned by Century 21 Real Estate LLC. Franchisee Legal Entity Name (not the dba) fully supports the principles of the Fair Housing Act and the Equal Opportunity Act. Each franchise is independently owned and operated. Any services or products provided by independently owned and operated franchisees are not provided by, affiliated with, or related to Century 21 Real Estate LLC nor any of its affiliated companies.
