

Connecticut Real Estate Market Pulse
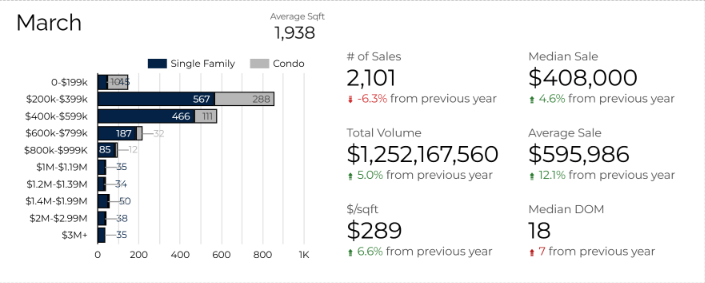 Key Takeaway: Despite a 6.3% dip in the total number of sales compared to last year, the Average Sale Price has surged 12.1% to $595,986. This confirms that while fewer transactions are occurring, the value of those homes is reaching new heights.
Understanding the Multi-Year Trajectory
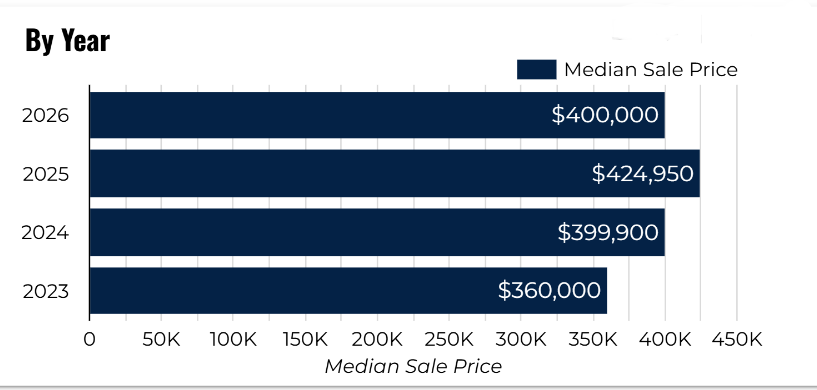
It is important to contextualize our current 2026 data. While a quick look at an annual bar chart might suggest a slight dip, remember that the 2026 figure only represents the first three months of the year.
The Spring Surge: 2026 vs. 2025
When we look at the time-series data, the "climb" for 2026 is actually starting from a much higher floor than previous years, indicating a very strong foundation for the upcoming peak season.
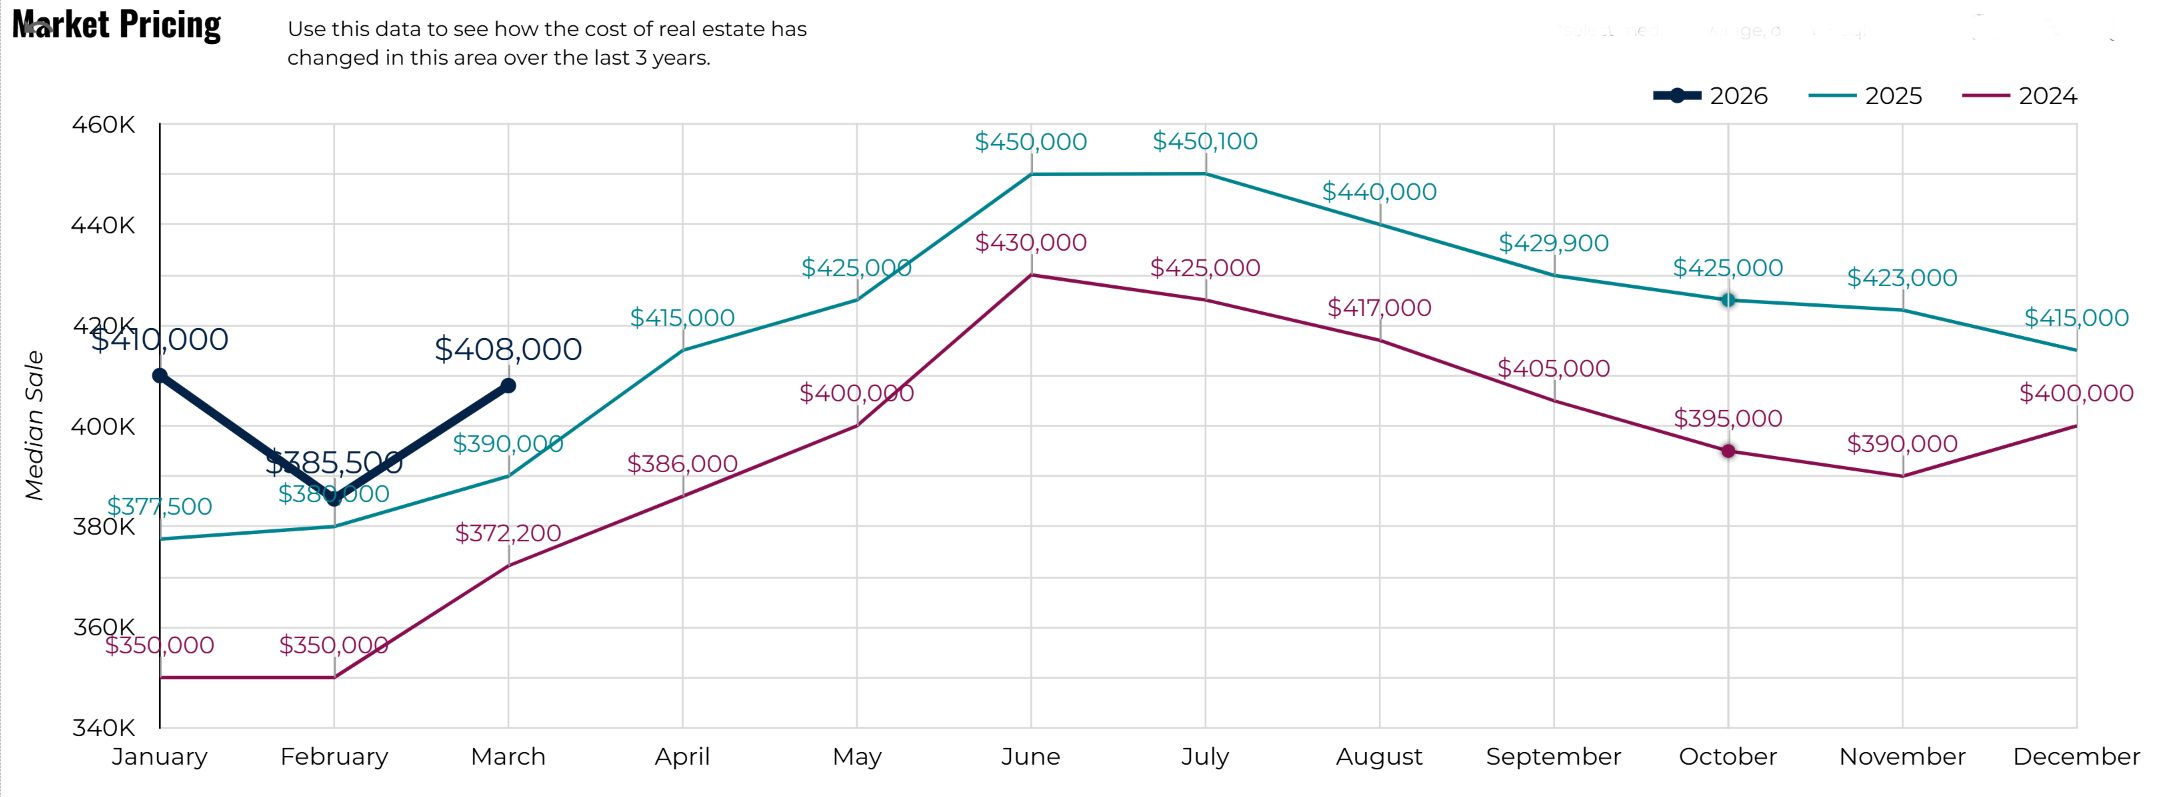
Notice the dark blue line representing 2026. We started January at $410,000—significantly higher than the $377,000 start in 2025. This "head start" suggests that 2026 is on track to potentially break all-time pricing records by mid-summer.
Recent Performance Table
For those tracking specific month-over-month shifts, here is the raw breakdown of the CT market's performance leading into the spring:
| Month | # of Sales | Median Sale | Avg. Sale | DOM |
|---|---|---|---|---|
| March 2026 | 2,101 | $408,000 | $595,986 | 18 |
| Feb 2026 | 1,774 | $385,500 | $534,307 | 20 |
| Jan 2026 | 2,070 | $410,000 | $565,469 | 18 |
| Dec 2025 | 3,049 | $415,000 | $575,763 | 14 |
For Sellers
Your equity is at a historic high. While the Median Days on Market (DOM) has ticked up slightly to 18 days, the window to list and sell before the summer inventory surge is wide open.
For Buyers
The market remains competitive, but the slight increase in DOM (up 7 days from March 2025) provides a sliver of "breathing room" that wasn't available 12 months ago. Preparation is your best tool.
With average prices up 12%, do you know what your home is worth today?
Request your equity report !
Let’s connect and strategize your next move today

How to Position Your Portfolio as Bonds Sell Off & Housing Peaks
Navigating the Shift: Portfolio Positioning Guide Macro Strategy & Real Estate Navigating the Shift: How to Position Your Portfolio as Bonds Sell Off and Housing Hits Its Seasonal Peak Market Insights • Portfolio Strategy Guide As we cruise through mid-May, we are officially entering the absolute peak of the spring housing market. Sidewalks are busy, […]

The Wealth Preservation Pivot: Capitalizing on West Hartford’s Appreciation for a Low-Carry Lifestyle
The Wealth Preservation Pivot Capitalizing on West Hartford’s Appreciation to Secure a Low-Carry Lifestyle If you own property in West Hartford, you are likely sitting on significant equity. Demand for luxury real estate across Connecticut-and specifically in our high-density hubs-is on a steady rise. For many homeowners, this creates a psychological “waiting game”: Is this […]

West Hartford Real Estate: The “Sweet Spot” Price to Command a 7.4% Premium
Market Insights What is the right listing price to command the highest premium? A data-driven analysis of West Hartford sales (Last 60 Days). Avg. Over Asking $45,349 Median DOM 5 Days Highest Premium 36.7% In today’s West Hartford market, your list price is more than a number-it’s a strategic lever. Based on 61 recent closed […]

The Secret Weapon for Home Sellers: Why You Should Be Crashing Open Houses
Seller Strategy Know Your Competition: Why Savvy Sellers Should Scout Local Open Houses Selling a home is a competitive business. While it might feel counterintuitive to visit other listings when you’re busy prepping your own, attending local open houses is one of the most effective ways to gain a strategic advantage. It’s not about finding […]

Decoding the Hartford County Real Estate “Sweet Spot”: Volume vs. Intensity
Linkedin Facebook X Market Analysis: Decoding Buyer Demand in Hartford County By Alex Teplitskiy | Real Estate Insights In real estate, we often talk about the “sweet spot” of the market. To a casual observer, that might look like the price range where the most homes are selling. But for a savvy buyer or seller, […]
The #1 Hottest Market: Why Hartford Real Estate is Still a “Pressure Cooker”
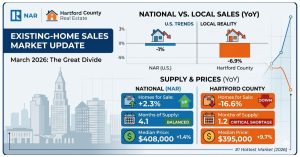
Facebook X Linkedin The Great Divide: Why Hartford is Defying National Real Estate Trends If you’ve been watching the national news lately, you might think the housing market is finally cooling off. Headlines from the National Association of Realtors (NAR) show inventory is rising and sales are slowing. But if you are looking for a […]
 Facebook
 X
X
 Pinterest
 Copy Link


© 2026 MoxiWorks
© CENTURY 21 2023 - 2024. All rights reserved. CENTURY 21®, C21® and the CENTURY 21 Logo are registered service marks owned by Century 21 Real Estate LLC. Franchisee Legal Entity Name (not the dba) fully supports the principles of the Fair Housing Act and the Equal Opportunity Act. Each franchise is independently owned and operated. Any services or products provided by independently owned and operated franchisees are not provided by, affiliated with, or related to Century 21 Real Estate LLC nor any of its affiliated companies.
