

The Hartford County Housing Hustle: How Fierce is the Fight for Homes?

1st Quarter Trends and the Bigger Picture
Using 2022—the last year of low interest rates and a more balanced market—as our benchmark, let's dive into what Hartford County housing data reveals about the 1st quarter of 2025
| 2022 | 2023 | 2024 | 2025 | |
|---|---|---|---|---|
| JAN | 659 | 573 | 547 | 602 |
| FEB | 761 | 605 | 643 | 575 |
| MAR | 1,078 | 774 | 706 | 827 |
The challenge
A Gap Between Listings and Sales
March 2025 recorded 827 new listings, a strong rebound compared to previous years. However, the number of sales remained consistent at 543, showing no significant growth in absorption. This gap raises the question: are sellers pricing homes beyond what buyers are willing—or able—to pay in this current market?
| 2022 | 2023 | 2024 | 2025 | |
|---|---|---|---|---|
| JAN | 786 | 538 | 542 | 567 |
| FEB | 606 | 464 | 452 | 479 |
| MAR | 768 | 600 | 537 | 543 |

THE DILEMMA
Pricing Disconnect
While median list prices in March 2025 rose 12% year-over-year to $359,000, buyers are negotiating differently. Median sale prices, at $333,250, reflect a 4% increase—a slower pace than the list price growth. The data suggests buyers are pushing back against higher asking prices, leading to a trend where homes sell for 7% below list price.
| 2022 | 2023 | 2024 | 2025 | YoY | |
|---|---|---|---|---|---|
| JAN | $269,900 | $289,900 | $305,000 | $325,000 | 7% |
| FEB | $279,900 | $299,900 | $315,000 | $340,000 | 8% |
| MAR | $279,900 | $314,900 | $319,900 | $359,000 | 12% |
| 2022 | 2023 | 2024 | 2025 | YoY | |
|---|---|---|---|---|---|
| JAN | $260,000 | $280,000 | $309,000 | $337,500 | 9% |
| FEB | $257,000 | $280,000 | $315,000 | $330,000 | 5% |
| MAR | $260,000 | $285,000 | $320,000 | $333,250 | 4% |


The results
 Market Signals
 Market Signals
The ratio of sales to new listings dropped to 0.66 in March, a significant shift from the absorption levels seen in 2022. This trend may indicate a recalibration in market activity—potentially a “glitch” or pivot toward a more balanced market.
| 2022 | 2023 | 2024 | 2025 | |
|---|---|---|---|---|
| JAN | 1.19 | 0.94 | 0.99 | 0.94 |
| FEB | 0.80 | 0.77 | 0.70 | 0.83 |
| MAR | 0.71 | 0.78 | 0.76 | 0.66 |

 Reality Check: This discrepancy between seller expectations and buyer behavior highlights an evolving market. Buyers are showing more restraint, likely influenced by higher mortgage rates and broader economic factors. What once was a market defined by overbidding has shifted into one where negotiations and pricing strategy are crucial.
THE TAKEAWAY
Negotiate Success
While the MLS's March market report for Hartford County highlights an average premium of 4.25% over the asking price, it's worth noting that comparing the median listing price to the median sale price provides a different perspective on the dataset. The median measure focuses on the middle range, offering insight that's less impacted by outliers, such as exceptionally high or low sale prices. This alternative comparison could reveal trends that better reflect the overall market's typical behavior.

Previous years show relative consistency in the first quarter, the data from 2025 reveals a notable shift. January stands out with the median sale price being over the median list price by 4%, marking the strongest seller advantage compared to previous years. In contrast, February and March highlight softer trends, with the median sale price being lower the median list price by 3% and 7%, respectively—suggesting buyers are negotiating more assertively. This break from the pattern suggests changing market dynamics, with buyers and sellers needing to adapt their strategies to the evolving conditions.
The takeaway is clear: negotiation skills are now paramount for navigating these fluctuations, ensuring sellers can maximize returns and buyers can seize opportunities for better deals
Navigating the Shift: Portfolio Positioning Guide Macro Strategy & Real Estate Navigating the Shift: How […]

The Wealth Preservation Pivot Capitalizing on West Hartford’s Appreciation to Secure a Low-Carry Lifestyle If […]

Market Insights What is the right listing price to command the highest premium? A data-driven […]

Seller Strategy Know Your Competition: Why Savvy Sellers Should Scout Local Open Houses Selling a […]

Linkedin Facebook X Market Analysis: Decoding Buyer Demand in Hartford County By Alex Teplitskiy | […]
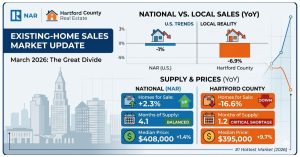
Facebook X Linkedin The Great Divide: Why Hartford is Defying National Real Estate Trends If […]
Need help? Book a call at a time to suit your schedule
As we watch this unfold, it’s a pivotal time for both buyers and sellers. Sellers may need to reassess pricing strategies to align with market realities, while buyers have an opportunity to leverage negotiating power.
 Facebook
 X
X
 Pinterest
 Copy Link

ALEX TEPLITSKIY
REALTOR®
(860) 543-9417


© 2026 MoxiWorks
© CENTURY 21 2023 - 2024. All rights reserved. CENTURY 21®, C21® and the CENTURY 21 Logo are registered service marks owned by Century 21 Real Estate LLC. Franchisee Legal Entity Name (not the dba) fully supports the principles of the Fair Housing Act and the Equal Opportunity Act. Each franchise is independently owned and operated. Any services or products provided by independently owned and operated franchisees are not provided by, affiliated with, or related to Century 21 Real Estate LLC nor any of its affiliated companies.
